


Strange attractors - beautiful chaos and canvas
 Math has the ability to both be totally awesome and beautiful as well as make me bang my head into the wall. While the actual math involved at times goes way above my head, some things are just so damn elegant and when, on top of that, they can be visualized with pretty pictures, I'm sold. To make things even better, we have <canvas> and with it the ability to throw some JavaScript at this
 magic math.
Links to gallery and generator at the bottom if you want to skip the details.
I'm sorry if I offend any math-enabled people with this post, I am but a mere mortal so bear with me if I mess up any of the math.
Anyway, fractals like the well-known Mandelbrot set (and many others) have that ability as do another category of mathematical creatures known as strange attractors. So what are they? I asked Wikipedia: While in every day use, one might think of an attractor as something that attracts stuff, in this context it's really the pattern or the result of what's going on in a system. E.g. if you're measuring and graphing the relationship between a number of variables over time, by connecting those points you could refer to the resulting pattern as an attractor.
A point attractor a simple form of attractor. Consider a pendulum. Release it and it will always, eventually, end up at rest in the same place. That resulting pattern (the point) would be the attractor for that system.
What about strange attractors, then? Chaos, alright. Among other things, that involves being very sensitive to initial conditions (butterfly -> wing-flapping -> tornado, etc). It's more complex that than, but that's where it just goes beyond what I can grok.
Ok, so what we need is a function that, when called over and over again, shows unpredictable and radically different behaviour if we change some initial conditions (even just slightly). Fortunately there are smart people who already found such functions.
One of those is the quadratic map given by
xn+1 = a0 + a1 xn + a2 xn2 + a3 xn yn + a4 yn + a5 yn2,
yn+1 = b0 + b1 xn + b2 xn2 + b3 xn yn + b4 yn + b5 yn2
where a0-a5 and b0-b5 are constants that make up that attractor. Another is the Peter de Jong attractor using trigonometric functions:
xn+1 = sin(a yn) - cos(b xn),
yn+1 = sin(a xn) - cos(b yn)
I've only played around with a few but there are many more. These, however, produce some very interesting visuals.
 One problem, at least in the case of the quadratic attractor, is that, if the a0-a5 and b0-b5 factors are chosen randomly, very few (like 1% for quadratic, the other formulas seem to have a higher rate of success) combinations produce a useful chaotic system. Determining which ones do is done using something called the Lyapunov exponent, which I won't go into but look it up if you're interested.
All this was heavily inspired by the work done by Paul Bourke who has done all sorts of awesome math visualization. The code itself is also partly based on a program available on Bourke's site.
View the gallery for pretty pictures or make your own using the generator. The way it works is that you pick a formula/attractor type and click "Generate". It then searches for potentially nice images by selecting random values for the ai and bi coefficients. When a chaotic attractor is found, it draws it on the screen, optionally with some pretty and colorful compositing (courtesy of Pixastic). You can recreate any attractor by using its seed number (displayed after the name). If you find some really nice ones, leave a comment with the seed and attractor type so I and others can see.
Also, If you're going to generate your own images, I really suggest using Chrome (or WebKit, although it has problems with the compositing). Any recent canvas enabled browser should work, though.
View the gallery
Try the generator
Read more...
Math has the ability to both be totally awesome and beautiful as well as make me bang my head into the wall. While the actual math involved at times goes way above my head, some things are just so damn elegant and when, on top of that, they can be visualized with pretty pictures, I'm sold. To make things even better, we have <canvas> and with it the ability to throw some JavaScript at this I'm sorry if I offend any math-enabled people with this post, I am but a mere mortal so bear with me if I mess up any of the math.
Anyway, fractals like the well-known Mandelbrot set (and many others) have that ability as do another category of mathematical creatures known as strange attractors. So what are they? I asked Wikipedia:
"An attractor is a set to which a dynamical system evolves after a long enough time."
While in every day use, one might think of an attractor as something that attracts stuff, in this context it's really the pattern or the result of what's going on in a system. E.g. if you're measuring and graphing the relationship between a number of variables over time, by connecting those points you could refer to the resulting pattern as an attractor.
A point attractor a simple form of attractor. Consider a pendulum. Release it and it will always, eventually, end up at rest in the same place. That resulting pattern (the point) would be the attractor for that system.
What about strange attractors, then?
"An attractor is informally described as strange if it has non-integer dimension or if the dynamics on it are chaotic."
Chaos, alright. Among other things, that involves being very sensitive to initial conditions (butterfly -> wing-flapping -> tornado, etc). It's more complex that than, but that's where it just goes beyond what I can grok.
Ok, so what we need is a function that, when called over and over again, shows unpredictable and radically different behaviour if we change some initial conditions (even just slightly). Fortunately there are smart people who already found such functions.
One of those is the quadratic map given by
xn+1 = a0 + a1 xn + a2 xn2 + a3 xn yn + a4 yn + a5 yn2,
yn+1 = b0 + b1 xn + b2 xn2 + b3 xn yn + b4 yn + b5 yn2
where a0-a5 and b0-b5 are constants that make up that attractor. Another is the Peter de Jong attractor using trigonometric functions:
xn+1 = sin(a yn) - cos(b xn),
yn+1 = sin(a xn) - cos(b yn)
I've only played around with a few but there are many more. These, however, produce some very interesting visuals.
One problem, at least in the case of the quadratic attractor, is that, if the a0-a5 and b0-b5 factors are chosen randomly, very few (like 1% for quadratic, the other formulas seem to have a higher rate of success) combinations produce a useful chaotic system. Determining which ones do is done using something called the Lyapunov exponent, which I won't go into but look it up if you're interested.
All this was heavily inspired by the work done by Paul Bourke who has done all sorts of awesome math visualization. The code itself is also partly based on a program available on Bourke's site.
View the gallery for pretty pictures or make your own using the generator. The way it works is that you pick a formula/attractor type and click "Generate". It then searches for potentially nice images by selecting random values for the ai and bi coefficients. When a chaotic attractor is found, it draws it on the screen, optionally with some pretty and colorful compositing (courtesy of Pixastic). You can recreate any attractor by using its seed number (displayed after the name). If you find some really nice ones, leave a comment with the seed and attractor type so I and others can see.
Also, If you're going to generate your own images, I really suggest using Chrome (or WebKit, although it has problems with the compositing). Any recent canvas enabled browser should work, though.
View the gallery
Try the generator
Read more...
The FlickrBrot - Happy Birthday, Mandelbrot!
 Today is the birthday of Benoit Mandelbrot.
About 30 years ago he pulled a bit of mathematical beauty out of his head that would make him father of what is called fractal geometry.
Today, at 84, he's a retired Sterling Professor from Yale but is still getting awards thrown his way and even planets named after him. I thought I'd make something to mark his birthday since I've been playing a bit with fractals and JavaScript lately and because he's just damn cool.
If you haven't already, check out the minimized sub-128 bytes Mandelbrot as well as the prettier and fancier Canvas fractal renderer to see the previous Mandelbrot related posts.
Today is the birthday of Benoit Mandelbrot.
About 30 years ago he pulled a bit of mathematical beauty out of his head that would make him father of what is called fractal geometry.
Today, at 84, he's a retired Sterling Professor from Yale but is still getting awards thrown his way and even planets named after him. I thought I'd make something to mark his birthday since I've been playing a bit with fractals and JavaScript lately and because he's just damn cool.
If you haven't already, check out the minimized sub-128 bytes Mandelbrot as well as the prettier and fancier Canvas fractal renderer to see the previous Mandelbrot related posts.
If you want to read more about the Mandelbrot set and fractals in general, I suggest you hit up Wikipedia (lots of juicy math!). What it comes down to, though, is that very simple formulas can produce the most fascinating, infinitely complex structures which in turn can be made into pretty pictures on a computer.
So, what I've spent my morning doing is hacking together my fractal renderer with some of the Flickr stuff I've also been doing. Instead of drawing colored pixels, it now pulls in a (limited) number of Flickr images and uses those to paint a visualization of the Mandelbrot set.
You can add a parameter to the url to search for a specific query at Flickr, ie. ".../flickrbrot/?puppies", although the images are painted so small it's pretty hard to discern what they really are. Searching for a specific color can sometimes produce a nicer looking result, ie. "?orange" or "?purple".
Only Firefox, Opera and Webkit nightly!
Check it out here.
Suggested listening: Jonathan Coulton - Mandelbrot Set
Read more...
Today is the birthday of Benoit Mandelbrot.
About 30 years ago he pulled a bit of mathematical beauty out of his head that would make him father of what is called fractal geometry.
Today, at 84, he's a retired Sterling Professor from Yale but is still getting awards thrown his way and even planets named after him. I thought I'd make something to mark his birthday since I've been playing a bit with fractals and JavaScript lately and because he's just damn cool.
If you haven't already, check out the minimized sub-128 bytes Mandelbrot as well as the prettier and fancier Canvas fractal renderer to see the previous Mandelbrot related posts.
If you want to read more about the Mandelbrot set and fractals in general, I suggest you hit up Wikipedia (lots of juicy math!). What it comes down to, though, is that very simple formulas can produce the most fascinating, infinitely complex structures which in turn can be made into pretty pictures on a computer.
So, what I've spent my morning doing is hacking together my fractal renderer with some of the Flickr stuff I've also been doing. Instead of drawing colored pixels, it now pulls in a (limited) number of Flickr images and uses those to paint a visualization of the Mandelbrot set.
You can add a parameter to the url to search for a specific query at Flickr, ie. ".../flickrbrot/?puppies", although the images are painted so small it's pretty hard to discern what they really are. Searching for a specific color can sometimes produce a nicer looking result, ie. "?orange" or "?purple".
Only Firefox, Opera and Webkit nightly!
Check it out here.
Suggested listening: Jonathan Coulton - Mandelbrot Set
Read more...
23 pretty JavaScript fractals
 The previous post about the size optimized Mandelbrot renderers didn't really do the Mandelbrot set justice in terms of mathematical and aesthetical prettiness. So, armed with my two good friends, Canvas and JavaScript, I set out to further explore the infinite beauty and complexity of both the Mandelbrot set and other fractals.
The result is a small application that lets you view visualizations (colored or b/w) of different fractals and zoom in by simply clicking the mouse. There are a few different fractals available:
The controls should be fairly self-explanatory, but here they are anyway:
Note that changing some of the settings causes an immediate re-render of the image.
Be warned that the further you zoom in on any of the fractals, the more CPU time is needed to render, and of course a large image size is more demanding than a small one. I've found Safari with latest WebKit nightly to be the fastest but YMMV. Firefox 3 seems to have memory issues when you zoom in more than a few times and there is of course no IE support.
And for the finish, here are a few images from a zoomed-in Mandelbrot set.


Play with JavaScript fractals here Read more...
The previous post about the size optimized Mandelbrot renderers didn't really do the Mandelbrot set justice in terms of mathematical and aesthetical prettiness. So, armed with my two good friends, Canvas and JavaScript, I set out to further explore the infinite beauty and complexity of both the Mandelbrot set and other fractals.
The result is a small application that lets you view visualizations (colored or b/w) of different fractals and zoom in by simply clicking the mouse. There are a few different fractals available:
 Mandelbrot set - The granddaddy of all fractals, the work of super smart mathemagician Benoît Mandelbrot. This one shouldn't need much introduction. Also available are a few Multibrots, variations on the Mandelbrot theme created by raising z to higher powers, rather than the standard z^2 of the Mandelbrot.
 Tricorn - Another variation of the Mandelbrot set, also sometimes called the Mandelbar.
- Burning Ship - Another famous fractal, named after the neat structures that appear when zooming in along the x-axis on the positive side. This is the one depicted at the very beginning of this post.
- Julia set - Created much like the Mandelbrot set, but using a constant complex number C. Depending on the complex number used, this will render in any number of different ways. A selection of numbers are available. Dendrite, Siegel Disk, Douady's Rabbit and San Marco are all also variations of the Julia set.
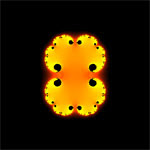

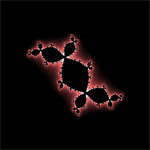
- Julia Cubed - A variation of the Julia set, using z^3 instead of z^2. Much like the Multibrot variations of the Mandelbrot set.

- Julia Sine/Cosine - More variations of the Julia set, now using trigonometric functions to create interesting structures. Note that these are a bit slower than the rest due to the many extra function calls.

The controls should be fairly self-explanatory, but here they are anyway:
- Image size: The dimensions of the rendered image. Smaller = faster.
- Color scheme: The color used when painting the fractal. Black/white might be a bit faster.
- Smooth colors: A prettier but slower coloring algorithm. The image may look darker when using smooth colors. Only works well for Mandelbrot and Julia set (using z^2) and causes banding when zooming in.
- Zoom factor: How much to zoom in when clicking.
Note that changing some of the settings causes an immediate re-render of the image.
Be warned that the further you zoom in on any of the fractals, the more CPU time is needed to render, and of course a large image size is more demanding than a small one. I've found Safari with latest WebKit nightly to be the fastest but YMMV. Firefox 3 seems to have memory issues when you zoom in more than a few times and there is of course no IE support.
And for the finish, here are a few images from a zoomed-in Mandelbrot set.
Play with JavaScript fractals here Read more...
Mandelbrot in less than 128 bytes of DHTML
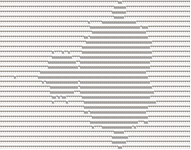 A while ago, Mathieu "p01" Henri rendered the initial Mandelbrot set in 137 bytes of JavaScript and HTML, getting it down to 133 bytes with a few tweaks but still a few bytes short of his 128 byte goal. Since fractals are groovy, I decided to make my own, trying to get it below that magic number.
The smallest HTML overhead I could think of was to just have a single <body> tag with an onload event doing everything. Unfortunately this doesn't seem to work in Safari and Chrome, but FF, IE and Opera are all happy. Other than that, it's just a lot of tweaking and dirty tricks do shave off every possible byte.
I first managed to get it down to 122 bytes.
Check it out here
Didn't take long for Mathieu to respond, though, and he shaved off a few more bytes down to just 117 bytes. Very cool! See his version here.
And if anyone finds a way to make it even smaller, please leave a comment.
Updates:
1: With the help of David 'HZR' Hasater, Mathieu's is now down to 115 bytes, losing IE support along the way.
2: Final version so far only works in Firefox and is only 114 bytes
3: Ok, one more. A slightly different look (less defined boundary) and another byte sent off: 113 bytes Read more...
A while ago, Mathieu "p01" Henri rendered the initial Mandelbrot set in 137 bytes of JavaScript and HTML, getting it down to 133 bytes with a few tweaks but still a few bytes short of his 128 byte goal. Since fractals are groovy, I decided to make my own, trying to get it below that magic number.
The smallest HTML overhead I could think of was to just have a single <body> tag with an onload event doing everything. Unfortunately this doesn't seem to work in Safari and Chrome, but FF, IE and Opera are all happy. Other than that, it's just a lot of tweaking and dirty tricks do shave off every possible byte.
I first managed to get it down to 122 bytes.
Check it out here
Didn't take long for Mathieu to respond, though, and he shaved off a few more bytes down to just 117 bytes. Very cool! See his version here.
And if anyone finds a way to make it even smaller, please leave a comment.
Updates:
1: With the help of David 'HZR' Hasater, Mathieu's is now down to 115 bytes, losing IE support along the way.
2: Final version so far only works in Firefox and is only 114 bytes
3: Ok, one more. A slightly different look (less defined boundary) and another byte sent off: 113 bytes Read more...
